
Paolo Bonifazi, Asier Erramuzpe, Ibai Diez, Iñigo Gabilondo, Matthieu P. Boisgontier, Lisa Pauwels, Sebastiano Stramaglia, Stephan Swinnen, Borja Camino-Pontes, Antonio Jimenez-Marin, Jesus M. Cortes. Structure-function multi-scale connectomics is an accurate predictor of brain aging. OHBM 2019 – Organization for Human Brain Mapping [pdf]
Introduction:
Aging is a dynamical process that encompasses a systemic time-dependent decline on multiple scales from biological to psychological and social levels. Interestingly, individuals with the same chronological age (ChA) might exhibit different trajectories of age-related biological deterioration. This mismatch re ects two different concepts of age. One is ChA, calculated as the time running as birth, whereas the other is the biological age, which, irrespective of birth year is based on the level of biological maturation at a given time. Here, we extend previous work (Gaser et al 2013; Cole et al., 2015; Cole et al. 2017) and build a novel data-driven approach that estimates the Brain Connectome Age (BCA) exclusively based on a combination of structure–function connectome biomarkers. These results were recently published in (Bonifazi et al. 2018).
Methods:
Participants were recruited in Leuven (PI: Stephan Swinnen). N = 155 healthy volunteers (81 females) ranging in age from 10 to 80 years (mean age 44.4 years, SD 22.1 years) participated in the study, approved by the local ethics committee. Triple acquisitions T1, resting fMRI and DTI were acquired per each participant. Structural connectivity (SC) was built by counting the number of white matter streamlines connecting all region pairs within the entire 2514 regions of interest using the Craddock functional atlas (Craddock et al, 2012). Functional connectivity (FC) was built by obtaining the pairwise Pearson correlation coef cient between the resting fMRI time series. From both SC and FC matrices, we built the correlo-dendrogram of brain aging by correlating ChA with the values of internal (intra-module) and external (inter-module) connectivity at each dendrogram level M of the Brain Hierarchical Atlas (Diez et al 2015). To calculate BCA, we performed a multi-scale methodology by combining different connectivity metrics at different levels of M and building a maximum likelihood estimator of ChA. The classi cation accuracy was estimated by splitting training + testing datasets, that is, calculating BCA in the training data set and calculating the mean absolute error (MAE) as an accuracy metrics in the testing data set.
Results:
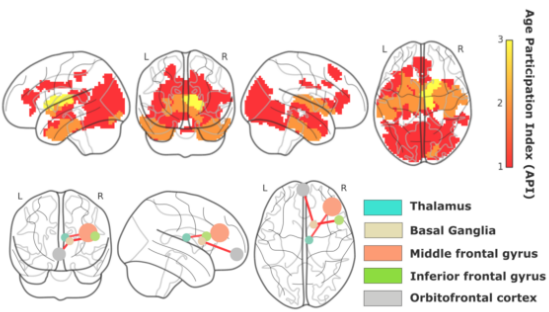
By combining four classes –functional-external, functional-internal, structural-external and structural-internal– of connectivity features, we calculated BCA and obtained the optimal solution with K = 38 features (Figure), corresponding to a MAE=5.89 years. By looking into the connectivity of the brain areas that best predicted ChA, we found that the connectivity between caudate, putamen, pallidum and thalamus towards the frontal and orbitofrontal cortices was the most dominant circuit, the so-called fronto-striato-thalamic (FST) circuit. Of note, other brain areas such as hippocampus also participated in the prediction of brain aging but to a lesser extent.
Conclusions:
Here, we calculated BCA exclusively based on connectivity metrics, and therefore, we did not take into consideration typical morphological characteristics, such as gray and white matter atrophy or ventricular volume, that have been widely shown to correlate with ChA. Our results show that FST is the key circuit accounting for the age estimation in contrast to the hippocampus conjecture, commonly believed the most critical circuit for brain aging and age-related degeneration.
The originality of our approach is based on identifying in multi-scale manner brain areas whose connectivity correlate with age. Such a methodology provides a quantitative approach to assess the impact of therapies on biological brain aging (ideally rejuvenating the brain connectome), disease (accelerating the connectome aging) ) or other factors shaping lifestyle. Notice that the same methodology can be used to correlate any other graded variable with the brain connectome, thus allowing for brain connectome estimators of any other biomarker, such as protein levels from CSF or blood, or a clinical scale.
